'%3e%3cpath%20d='M34.1406%205.85938C30.3906%202.10547%2025.3047%200%2020%200C14.6953%200%209.60938%202.10547%205.85938%205.85938C2.10938%209.61328%200%2014.6953%200%2020C0%2025.3047%202.10547%2030.3906%205.85938%2034.1406C9.61328%2037.8906%2014.6953%2040%2020%2040C25.3047%2040%2030.3906%2037.8945%2034.1406%2034.1406C37.8906%2030.3906%2040%2025.3047%2040%2020C40%2014.6953%2037.8945%209.60938%2034.1406%205.85938ZM37.0117%2023.543H31.1602V13.5391H27.6328V19.9414C28.1211%2020.6914%2028.3711%2021.582%2028.3711%2022.5625V22.625C28.3711%2023.668%2028.1172%2024.6055%2027.6328%2025.4297V26.6094H36.082C33.4883%2032.9375%2027.2891%2037.3789%2020.0039%2037.3789C10.3711%2037.3789%202.62109%2029.6289%202.62109%2020C2.62109%2010.3711%2010.3711%202.62109%2020%202.62109C29.6289%202.62109%2037.3789%2010.3711%2037.3789%2020C37.3789%2021.1484%2037.2617%2022.2656%2037.0508%2023.3477C37.0391%2023.4141%2037.0234%2023.4766%2037.0117%2023.543Z'%20fill='white'/%3e%3cpath%20d='M22.3086%2018.5352C20.4336%2018.125%2019.9531%2017.8398%2019.9766%2017.1836V17.1406C19.9766%2016.6992%2020.3477%2016.2148%2021.4023%2016.2148C22.582%2016.2148%2023.8867%2016.6797%2025.0781%2017.4766L26.8516%2015.0195C25.4453%2013.8906%2023.707%2013.3398%2021.5547%2013.3398C18.5195%2013.3398%2016.4375%2015%2016.4063%2017.4766V17.5352C16.3633%2020.2617%2018.5859%2020.9805%2021.293%2021.6016C23.0391%2021.9766%2023.5703%2022.3164%2023.5703%2022.9609L23.5469%2022.9766C23.5469%2023.3906%2023.2578%2023.7031%2022.7852%2023.8359C22.5742%2023.9062%2022.1289%2023.9727%2021.5156%2023.9727C20.7617%2023.9727%2019.7539%2023.8633%2018.6328%2023.4844C18.0898%2023.2891%2017.4727%2023.0039%2016.8047%2022.6133L20.1406%2026.625C20.2813%2026.6602%2021.0977%2026.8516%2021.7734%2026.8516C25.0039%2026.8516%2027.0859%2025.2461%2027.1094%2022.6328V22.5703C27.1602%2020.1133%2025.2148%2019.1719%2022.3086%2018.5352Z'%20fill='white'/%3e%3cpath%20d='M5.24219%2013.5664V26.6133H8.75391V23.7578L10.2969%2021.9531L14.2031%2026.6133H18.3867L12.3555%2019.5195L17.4023%2013.5664H13.4531L8.75391%2019.0586V13.5664H5.24219Z'%20fill='white'/%3e%3c/g%3e%3cdefs%3e%3cclipPath%20id='clip0_97_2430'%3e%3crect%20width='40'%20height='40'%20fill='white'/%3e%3c/clipPath%3e%3c/defs%3e%3c/svg%3e)

Utah Breaking News, Sports and Weather


Latest News & Features

Firefighters, community honor Provo captain and family killed in flash flood
Shelby Lofton and Andrew Adams, KSL | Posted July 21 - 10:30 p.m. | Save Story
Firefighters across northern Utah lined overpasses to honor Provo Fire Captain Spencer Long and four members of his family who were killed in a flash flood during a weekend camping trip.

Scam victims may have a chance to recover stolen money — but they must act fast
Matt Gephardt, KSL | Posted July 21 - 10:00 p.m. | Save Story
The FBI has a team that works directly with banks to track and freeze fraudulent transfers, giving victims of scams something they often think they've lost: a chance.

Trump approves nuclear agreement that may allow Saudi Arabia to enrich uranium, two AP sources say
Aamer Madhani, Michelle L. Price and Jon Gambrell, Associated Press | Posted July 21 - 9:30 p.m. | Save Story
President Donald Trump has approved an agreement with Saudi Arabia that could potentially provide the kingdom with uranium enrichment capability for its civilian nuclear program, according to two people familiar with the matter.

A new e-scooter company is adding 1,000 vehicles to Salt Lake City's streets
Carter Williams, KSL | Posted July 21 - 8:30 p.m. | Save Story
Veo Micromobility plans to add about 1,000 e-scooters to Salt Lake City's streets beginning on Wednesday, as it begins a five-year agreement with the city.

New Jersey says software error put 6,600 noncitizens on voter rolls
Doina Chiacu, Reuters | Updated July 21 - 8:00 p.m. | Save Story
Roughly 6,600 people who were not U.S. citizens were accidentally added to New Jersey's voter rolls because of a software error at the state motor vehicles department.
Logan man accused of domestic violence in custody after he escaped police chase last week
Cassidy Wixom, KSL | Posted July 21 - 7:30 p.m. | Save Story
A Logan man, accused of assaulting his girlfriend before fleeing from police during which he allegedly crashed into a car and swam through a marina to escape, has been taken into custody.
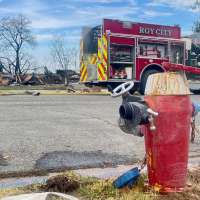
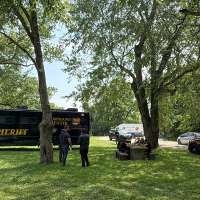
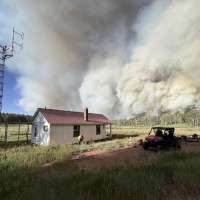
Feds, state officials probe Roy fire that torched 3 homes, but quiet for now on cause
Tim Vandenack, KSL | Updated July 21 - 6:45 p.m. | Save Story
ATF, state and local officials are investigating the Roy fire along a rail corridor that torched 3 homes, but remain quiet, at least for now, on the cause.

US pauses $1B in Medicaid payments to California, Minnesota
Ahmed Aboulenein, Reuters | Updated July 21 - 6:30 p.m. | Save Story
The Trump administration is pausing Medicaid payments to California and Minnesota over "suspected fraud and noncompliance," Health Secretary Robert F. Kennedy Jr. said Tuesday.
Man gets consecutive sentences after taking two cars, one with baby still inside
Emily Ashcraft, KSL | Posted July 21 - 6:00 p.m. | Save Story
A man will serve consecutive prison sentences in two cases where he took cars from other people — one from a nearby mom whose baby was initially still inside.

Beaver school employees keep kids fed despite water woes
Daniel Woodruff, KSL | Updated July 21 - 5:30 p.m. | Save Story
Not having water has made things complicated for Beaver County School District employees who feed hundreds of children during the summer, but quitting was never an option.

Arizona Republicans pick nominees Tuesday for governor and other top offices
Jonathan J. Cooper, Associated Press | Updated July 21 - 5:00 p.m. | Save Story
Arizona Republicans are choosing nominees Tuesday to challenge Democrats who hold top offices as the GOP looks to return to power in a battleground state it used to dominate.

Utah man accused of ramming patrol cars, including one driven by sheriff
Pat Reavy, KSL | Posted July 21 - 4:30 p.m. | Save Story
A man allegedly trying to flee from a domestic violence investigation is accused of hitting two patrol cars and assaulting two other deputies.

Utah County man charged again with abusing dog
Pat Reavy, KSL | Posted July 21 - 4:00 p.m. | Save Story
An Eagle Mountain man is facing an animal abuse charge in 4th District Court for the second time in three months and accused of beating the same dog.
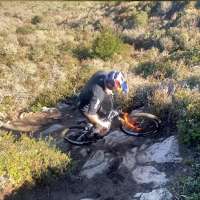
Have You Seen This? Mountain biker rock-hops '(almost) impossible hill'
Arianne Brown, KSL | Posted July 21 - 3:33 p.m. | Save Story
Running up a mountain and biking up a mountain are not only two very different skill sets, but they require a whole other set of muscles, and much larger levels of lung capacity.

Appeals court rejects Biden's bid to block release of recordings of ghostwriter interviews
Michael Kunzelman, Associated Press | Updated July 21 - 3:00 p.m. | Save Story
A federal appeals court has rejected a request by Joe Biden to block the release of audio recordings and transcripts of his interviews with a memoir ghostwriter before he was elected.
5 dead in attempt to save a struggling swimmer in an Ohio river, sheriff says
The Associated Press | Updated July 21 - 2:30 p.m. | Save Story
Authorities say five people have died on a river in Ohio after several of them went into the water to assist another person who was struggling to swim.
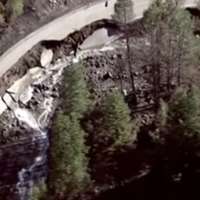
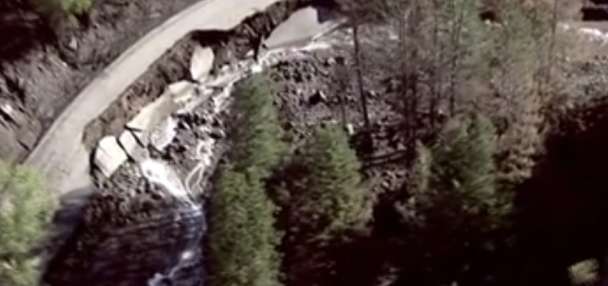
Parts of scenic SR 153 in southern Utah washed out, forcing UDOT to close it indefinitely
Carter Williams, KSL | Updated July 21 - 1:55 p.m. | Save Story
A highway that cuts through Beaver Canyon is now closed indefinitely after Sunday's floods washed away segments of the road.

Warrant issued for man accused of assaulting woman while driving
Pat Reavy, KSL | Posted July 21 - 1:34 p.m. | Save Story
A man accused of repeatedly punching a woman while driving and then continuing the assault after he pulled over has been charged with attempted murder.
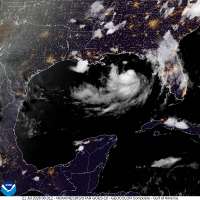
Tropical Storm Bertha in the Gulf of Mexico moves toward the Florida Panhandle and Alabama
The Associated Press | Posted July 21 - 1:01 p.m. | Save Story
Tropical Storm Bertha strengthened in the Gulf of Mexico, moving slowly toward the Florida Panhandle and Alabama, causing a tropical storm warning and storm surge watches, forecasters said.

PARTNER
This program is teaching human rights to children in 23 countries. Here's how you can participate
Amy Ortiz, Deseret News | Posted July 21 - 12:27 p.m. | Save Story
The organization is bringing human rights education to children in an expanding number of countries.
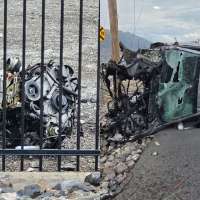
Road near Lindon boat harbor in Vineyard closed after crash
Joe R. Wirthlin Jr, KSL | Posted July 21 - 12:08 p.m. | Save Story
A road near the Lindon boat harbor in Vineyard was closed Tuesday after a car crash damaged multiple power poles, a fence and other property nearby.
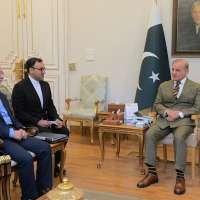
Attacks between US and Iran across Mideast overshadow efforts to keep diplomacy alive
Jon Gambrell and Munir Ahmed, Associated Press | Updated July 21 - 11:50 a.m. | Save Story
Diplomats are seeking to salvage the collapsed interim deal between Iran and the United States even as both countries continued to launch attacks in a 10th day of renewed fighting.
Forest Service determines what sparked Utah's largest fire so far this year
Carter Williams, KSL | Posted July 21 - 11:46 a.m. | Save Story
Federal foresters have finally determined what sparked Utah's largest wildfire nearly a decade.

Markets


-DJIA--
-Nasdaq--
-S&P 500--
STAY IN THE KNOW
Get informative articles and interesting stories delivered to your inbox weekly.
Subscribe to the KSL.com Trending 5.
By subscribing, you acknowledge and agree to KSL.com's
Terms of Use
and Privacy Notice.

Sports »

Weber State's Bayer earns medalist honors, setting up match play at 120th Utah women's state amateur
- Need for speed? Cade Uluave hopes to be difference maker for BYU after 4 years at Cal
- Spain wins the World Cup by beating Argentina 1-0 on Ferran Torres' goal in extra time
- Narumi's wonderstrike helps Utah Royals snap skid with much-needed 1-0 win over Orlando
- NHL announces complete 2026-27 Utah Mammoth schedule
Features »

Firefighters, community honor Provo captain and family killed in flash flood
- Have You Seen This? Mountain biker rock-hops '(almost) impossible hill'
- Parts of scenic SR 153 in southern Utah washed out, forcing UDOT to close it indefinitely
- Forest Service determines what sparked Utah's largest fire so far this year
- Judge to hear evidence against singer D4vd in killing, dismemberment of teen and decide on trial
Outdoors »

Parts of scenic SR 153 in southern Utah washed out, forcing UDOT to close it indefinitely
- Forest Service determines what sparked Utah's largest fire so far this year
- Rocky Mountain Airgun Challenge brings international competitors to Utah
- 'Folks are really, really upset': Reductions to 2 Utah monuments sparks protests
- Photographer provides an update on the tourist attacked by a bison in Yellowstone
World »

Trump approves nuclear agreement that may allow Saudi Arabia to enrich uranium, two AP sources say
- US military identifies 3rd service member believed to have been killed in Iranian attack
- France becomes the first EU country to ban social media for children
- US, Mexico resume USMCA trade talks as Trump hits Canada with new tariffs
- Trump says US-Lebanon flights can resume, pledges help for that country after meeting its president
U.S. »
Trump approves nuclear agreement that may allow Saudi Arabia to enrich uranium, two AP sources say
- New Jersey says software error put 6,600 noncitizens on voter rolls
- US pauses $1B in Medicaid payments to California, Minnesota
- US military identifies 3rd service member believed to have been killed in Iranian attack
- Army veteran charged with arson after allegedly throwing incendiary device at NYC federal building
Utah »
Firefighters, community honor Provo captain and family killed in flash flood
- South Salt Lake project causing head-on close-calls, residents plead for help
- Scam victims may have a chance to recover stolen money — but they must act fast
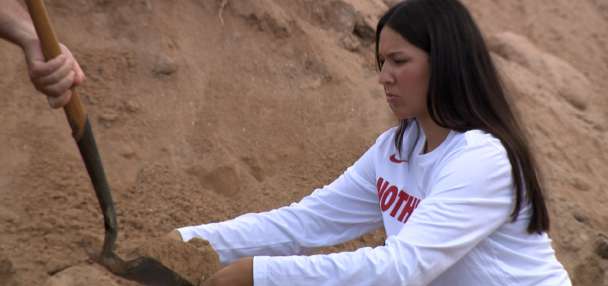
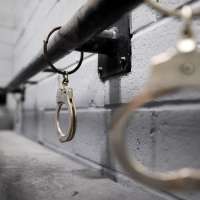
- Here's how Utah is trying to lower its criminal recidivism rate, according to a new report
- A new e-scooter company is adding 1,000 vehicles to Salt Lake City's streets
Voces de Utah »

Feds point to West Point killing in arguing for tougher action against criminal immigrants
- New Peruvian Consulate head to focus on community needs, gender issues, family violence
- Peruvian, Colombian communities hosting events to mark the nations' independence from Spain
- Commission pushes private jail ban in Salt Lake City amid ICE facility concerns
- Utah Royals, Miller Sports hosting soccer, baseball events geared to Latino fanbase
Business »

Scam victims may have a chance to recover stolen money — but they must act fast
- A new e-scooter company is adding 1,000 vehicles to Salt Lake City's streets
- France becomes the first EU country to ban social media for children
- US, Mexico resume USMCA trade talks as Trump hits Canada with new tariffs
- Trump says US-Lebanon flights can resume, pledges help for that country after meeting its president
Politics »
Trump approves nuclear agreement that may allow Saudi Arabia to enrich uranium, two AP sources say
»
Firefighters, community honor Provo captain and family killed in flash flood
- South Salt Lake project causing head-on close-calls, residents plead for help
- Scam victims may have a chance to recover stolen money — but they must act fast
- Here's how Utah is trying to lower its criminal recidivism rate, according to a new report
- A new e-scooter company is adding 1,000 vehicles to Salt Lake City's streets
