Estimated read time: 4-5 minutes
This archived news story is available only for your personal, non-commercial use. Information in the story may be outdated or superseded by additional information. Reading or replaying the story in its archived form does not constitute a republication of the story.
SALT LAKE CITY — Utah water experts have already considered the state's 2022 water year an improvement from the previous two, but not really great, either.
This is based on a pair of data points from two federal agencies that track moisture delivered in Utah annually: the National Centers for Environmental Information, a branch of the National Oceanic and Atmospheric Administration, and the Natural Resources Conservation Service, an arm of the U.S. Department of Agriculture. These agencies produce two models with entirely different figures regarding the 2022 water year, which ended on Sept. 30.
The National Centers for Environmental Information published its final September figures on Tuesday, which show Utah collected, on average, 12.05 inches of water between Oct. 1, 2021, and Sept. 30, about 89% of the 30-year normal for the span of Utah's water year.
This average is significantly lower than the 28.3 inches of water that the Natural Resources Conservation Service reports Utah received during the 2022 water year, which is 97% of the 30-year normal.
Why are these numbers different?
The difference of these figures all comes down to location.
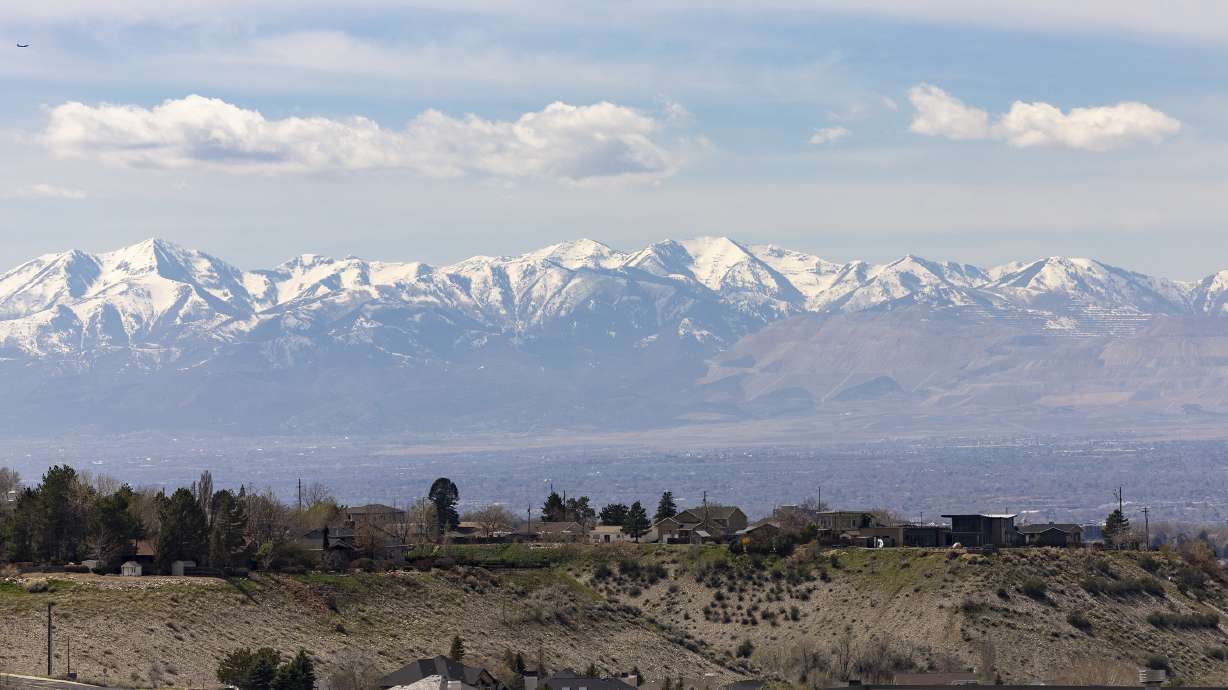
Jordan Clayton, the Utah snow survey supervisor with Natural Resources Conservation Service, explains that the conservation service moisture count is based on a collection of 137 mountain sites in the state. These sites are primarily used to track annual snowpack, which is the amount of water in the snow that falls in the state, but they also help understand soil moisture levels between every snow collection period.
"We're reporting on the source areas for all of our water, which is in the mountains," he told KSL.com on Thursday. "We're not really talking about, overall, how much precipitation has fallen in the state."
The National Centers for Environmental Information figure, on the other hand, is based on the collection of National Weather Service information across the state, which is primarily in the state's valleys. These include many areas that either don't get a lot of precipitation, or not nearly as much as the mountains do, which results in significantly lower annual totals.
Both of these numbers appear robust considering how dry Utah has been since the spring of 2020, but they can be a bit misleading. For example, while the mountain sites received 97% of their normal moisture levels during the water year, they only received 75% of their normal snowpack levels, which accounts for about 95% of the state's water supply.
The lower snowpack level resulted in less water ending up in the state's reservoirs than on average. However, the non-snow moisture helped boost soil moisture levels so more of the snowpack water actually flowed into the reservoirs as compared to the 2021 runoff. The moisture collected this summer should help the 2023 runoff, too.
There were also a lot of weather extremes throughout the 2022 water year. The exceptionally wet October and December 2021, months plus a solid monsoon season carried both figures, though, exceptionally dry periods at the start of 2022 and extreme heat in the summer offset some of the success of the overall water year.
This is why Utah water experts weren't exactly enthused by the 2022 water year.
As Laura Haskell, drought coordinator at the Utah Division of Water Resources, put it earlier this month: "There was a little bit of good, some bad, and it kind of all meshed together to be kind of meh."
So which figure matters more?
The Utah Division of Water Resources relies more on the Natural Resources Conservation Service figure. This makes sense because this figure helps pinpoint snowpack contact and soil moisture levels, which are key indicators for how much water ends up in the state's reservoirs in the spring and the efficiency of the spring runoff.
"That's where Utah's water is coming from; that's the source area," Clayton says, explaining the importance of the mountain sites.
However, both measures have a level of importance.
The mountain figures help pinpoint Utah's total water supply, while the valley locations may help understand some of the water demand, especially water used for agriculture or used on lawns when there isn't rain falling from the sky.
"We're also quite interested in what's going on in the valleys," Clayton says. "In theory, people are using less water in the valleys if they're getting precipitation there."


