'%3e%3cpath%20d='M34.1406%205.85938C30.3906%202.10547%2025.3047%200%2020%200C14.6953%200%209.60938%202.10547%205.85938%205.85938C2.10938%209.61328%200%2014.6953%200%2020C0%2025.3047%202.10547%2030.3906%205.85938%2034.1406C9.61328%2037.8906%2014.6953%2040%2020%2040C25.3047%2040%2030.3906%2037.8945%2034.1406%2034.1406C37.8906%2030.3906%2040%2025.3047%2040%2020C40%2014.6953%2037.8945%209.60938%2034.1406%205.85938ZM37.0117%2023.543H31.1602V13.5391H27.6328V19.9414C28.1211%2020.6914%2028.3711%2021.582%2028.3711%2022.5625V22.625C28.3711%2023.668%2028.1172%2024.6055%2027.6328%2025.4297V26.6094H36.082C33.4883%2032.9375%2027.2891%2037.3789%2020.0039%2037.3789C10.3711%2037.3789%202.62109%2029.6289%202.62109%2020C2.62109%2010.3711%2010.3711%202.62109%2020%202.62109C29.6289%202.62109%2037.3789%2010.3711%2037.3789%2020C37.3789%2021.1484%2037.2617%2022.2656%2037.0508%2023.3477C37.0391%2023.4141%2037.0234%2023.4766%2037.0117%2023.543Z'%20fill='white'/%3e%3cpath%20d='M22.3086%2018.5352C20.4336%2018.125%2019.9531%2017.8398%2019.9766%2017.1836V17.1406C19.9766%2016.6992%2020.3477%2016.2148%2021.4023%2016.2148C22.582%2016.2148%2023.8867%2016.6797%2025.0781%2017.4766L26.8516%2015.0195C25.4453%2013.8906%2023.707%2013.3398%2021.5547%2013.3398C18.5195%2013.3398%2016.4375%2015%2016.4063%2017.4766V17.5352C16.3633%2020.2617%2018.5859%2020.9805%2021.293%2021.6016C23.0391%2021.9766%2023.5703%2022.3164%2023.5703%2022.9609L23.5469%2022.9766C23.5469%2023.3906%2023.2578%2023.7031%2022.7852%2023.8359C22.5742%2023.9062%2022.1289%2023.9727%2021.5156%2023.9727C20.7617%2023.9727%2019.7539%2023.8633%2018.6328%2023.4844C18.0898%2023.2891%2017.4727%2023.0039%2016.8047%2022.6133L20.1406%2026.625C20.2813%2026.6602%2021.0977%2026.8516%2021.7734%2026.8516C25.0039%2026.8516%2027.0859%2025.2461%2027.1094%2022.6328V22.5703C27.1602%2020.1133%2025.2148%2019.1719%2022.3086%2018.5352Z'%20fill='white'/%3e%3cpath%20d='M5.24219%2013.5664V26.6133H8.75391V23.7578L10.2969%2021.9531L14.2031%2026.6133H18.3867L12.3555%2019.5195L17.4023%2013.5664H13.4531L8.75391%2019.0586V13.5664H5.24219Z'%20fill='white'/%3e%3c/g%3e%3cdefs%3e%3cclipPath%20id='clip0_97_2430'%3e%3crect%20width='40'%20height='40'%20fill='white'/%3e%3c/clipPath%3e%3c/defs%3e%3c/svg%3e)


Estimated read time: 9-10 minutes
This archived news story is available only for your personal, non-commercial use. Information in the story may be outdated or superseded by additional information. Reading or replaying the story in its archived form does not constitute a republication of the story.
SALT LAKE CITY — It’s been more than a month since Utah’s COVID-19 cases began to rise. In that space of time, we’ve all had to adjust to limitations and closures around the state and memorize the concept of social distancing.
There’s also been a lot of new information gathered about COVID-19 since the disease reached the state. Because it’s a novel virus, researchers around the world have had to race to figure out how it spreads, how it affects people and how to stop it.
For the first few weeks, experts advised that people 60 and older, and people with underlying health issues were most at risk. In a virtual press conference last week, Salt Lake County Health Department executive director Gary Edwards summed up Utah’s age demographics this way: "I would emphasize that our 20- (to) 40-year-old population in our county still has more cases than we would have expected them to have. We need this age group to please, please do your part."
The Utah Department of Health has also expanded testing guidelines over the past few weeks. The three symptoms that triggered a likely test in March were fever, shortness of breath and a dry cough; it’s now expanded to include sore throat, muscle aches and loss of taste or smell.
Over the past week, state and local health departments have released more detailed information about COVID-19 in the state and in the county most affected by the disease. Here’s what those data points show us about how COVID-19 has affected Utah:
More younger Utahns test positive; older Utahns more likely to be hospitalized
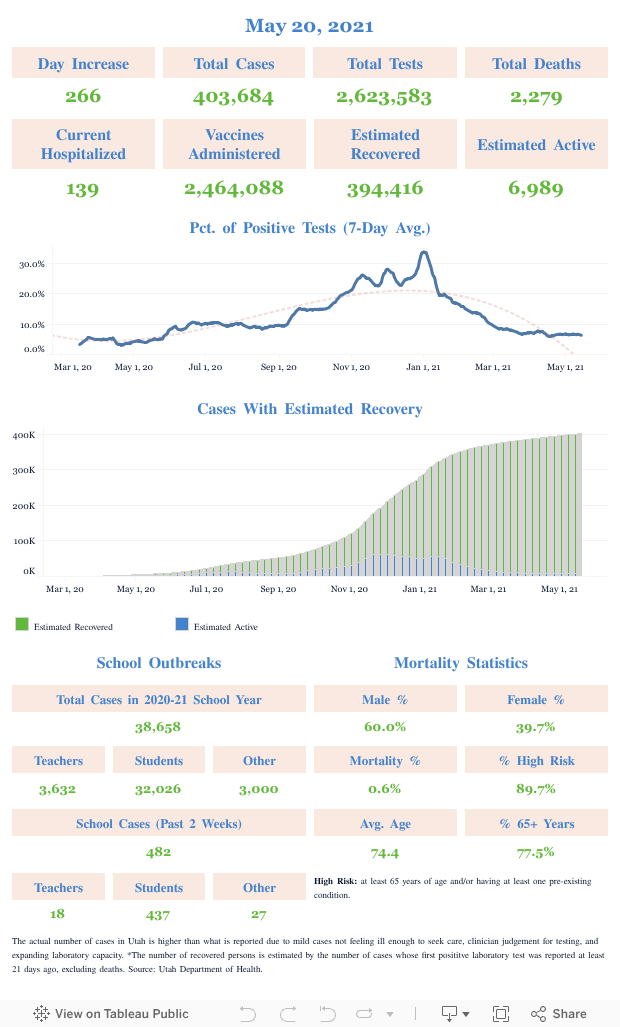
This goes to the point Edwards made last week. According to state health department data, adults aged 25-44 accounted for 1,023 of Utah’s 2,542 cases, or 40.2%, as of Wednesday. Add in ages 0-24, and 57.6% of all Utah cases involve someone 44 years old or younger.
That said, older adults are more likely to be hospitalized. Adults 45 years or older account for 161 of Utah’s 221 coronavirus-related hospitalizations, or nearly three-fourths of COVID-19 hospitalizations. As of Wednesday, the state’s overall hospitalization rate was about 8.7%. Broken down further, the hospitalization rate is 4.1% among Utahns aged 0-44 and about 15% for those 45 or older.
During a press briefing Wednesday, state epidemiologist Dr. Angela Dunn pointed out this information it doesn’t mean younger people have a free pass to roam around freely.
"Keep in mind, it’s more of the mild symptoms — those people who don’t need hospitalization — that are spreading it to more vulnerable (people) who do need hospitalization," Dunn said.
This data, of course, comes with another caveat: it doesn’t include underlying medical conditions, which are another key component to the severity of COVID-19. Family members of Silvia Melendez, a 24-year-old West Jordan woman who died from complications related to the coronavirus last month, said she had Type 2 diabetes and had undergone open-heart surgery for a tumor two years ago.
Her father, Marcos Melendez, spoke to KSL TV about his daughter’s death and added a message to all Utahns afterward: "Make sure you stay home. It’s better for everybody."
Gender doesn’t seem to factor in Utah’s case counts
The state also has broken the COVID-19 cases up by gender. Officials found more males have been diagnosed with COVID-19, but not by much. About 53.7% of Utah’s confirmed cases were male, and 46.3% were female as of Wednesday. The trend of nearly 50-50 shows up nearly across all age ranges.
Among children ages 1-14, 186 girls have tested positive, while 184 boys have tested positive in that age range. The widest gap between genders comes in the 25-44 and 65-84 age brackets, which each report about 55% men to 45% women.
A disproportionate number of Hispanic/Latino Utahns affected
The state health department tweeted a graphic on Tuesday that is expected to be added to its dashboard in the coming days. It broke Utah’s confirmed cases down into eight different races/ethnicities: American Indian or Alaska Native, Asian, black or African-American, Hispanic or Latino, Native Hawaiian or Pacific Islander, two or more, white and "unknown."
There isn’t a complete snapshot of Utah’s current population broken down by diversity available yet. The University of Utah’s Kem C. Gardner Institute released a 2019 report that analyzed Utah’s diversity and broke the state population down by similar groups. It found that, in 2015, white Utahns accounted for 79.2% of the population; all the other groups combined accounted for the other 20.8%. The largest minority group, Hispanic or Latino, accounted for about 13.7% of Utah’s population in 2015.
Yet white Utahns accounted for 55.5% of the state’s COVID-19 cases, as of Tuesday; Hispanic or Latino accounted for 28.4%, and unknown was third at 8.9%. Most other minority group percentages released by the department fell close to the population percentages in 2015.
.@DrAngelaCDunn will share some new #COVID19 data today on race/ethnicity. This information will be added to our daily case count report in the coming days. pic.twitter.com/zhdfO6zOzd
— Utah Dept. of Health (@UtahDepOfHealth) April 14, 2020
The Deseret News explored further into the state’s discrepancy on Tuesday. Maria Montes, community engagement and organizing coordinator for Comunidades Unidas, told the newspaper that reduced health care access and lack of information within Utah’s Latino community likely factor into this issue.
"Our providers are not prepared to provide health care in the most culturally adequate way," she said. They’re not always able to connect with patients in a way that humanizes the patients that are sitting in front of them."
Salt Lake County Health Department’s data shows further minority discrepancies. It found a rate of 211.1 residents per 100,000 among Hispanic or Latino. It also reported a 173.7 per 100,000 rate for Native Hawaiin or other Pacific Islander residents, 112.9 per 100,000 rate for black or African-American residents, and 112.4 per 100,000 rate for Asian residents. The county health department also reported a rate of 93.8 white residents per 100,000.
Cough is the most common symptom, but there are several common symptoms
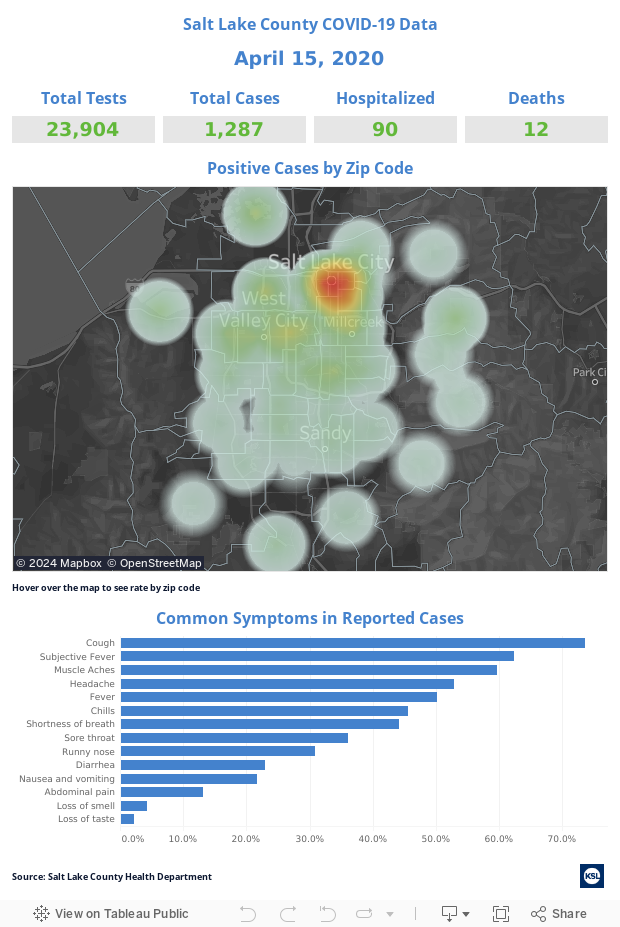
COVID-19 is a respiratory disease, so it’s no surprise that cough is the most commonly reported symptom in Salt Lake County, according to recently released Salt Lake County Health Department data. Since nearly half of Utah’s cases have been reported in Salt Lake County, this gives us a very solid sample size for what Utahns are reporting.
According to the county data, 74% of people who tested positive reported having a cough. Other commonly reported symptoms were: subjective fever (62%), muscle aches (60%), headache (53%) and fever (50%). Other reported symptoms include shortness of breath (46%), sore throat (36%), runny nose (31%), diarrhea (23%), nausea and vomiting (22%), abdominal pain (13%), loss of smell (4%) and loss of taste (2%).

Specific areas more affected by COVID-19? There's some data for that
The Salt Lake County Health Department also reports testing the most people and, as Edwards also pointed out last week, you’re going to have higher numbers the more you test. About half of Utah’s tests have been conducted in Salt Lake County.
The county’s health department has a cool tool that breaks down cases by zip code. And, it may come as no surprise that the highest rates come in densely packed Salt Lake City ZIP codes. The highest rate? 84101, as of Tuesday. That, in case you’re wondering, is a section of land within the western half of downtown Salt Lake City, which includes homes and businesses around The Gateway, Pioneer Park and the Triad Center.
According to the county’s health department website, it has a crude rate of 357.1 per 100,000 people, which on that scale is 141.8 more than the second-highest ZIP code, 84104 (Glendale neighborhood). Rounding out the top five are 84102 (Central Salt Lake City), 84116 (Rose Park and northwest quadrant of Salt Lake City) and 84119 (an area shared between South Salt Lake and West Valley City).
The lowest rate with 0 is 84006, which is the Copperton and Bingham Canyon area of western Salt Lake County.
So, can we link the county’s COVID-19 cases to population density? This has been a subject researchers have looked into and have struggled to figure out because case counts and mortality rates are all over the board in the U.S. and worldwide, The Hill reported.
The Salt Lake County data, while small and incomplete, seems to indicate little correlation at the moment. Town Charts used 2018 Census Bureau population estimates to rank the state’s top 25 cities in population density, so we crossed the density and case rate data and found differing results.
Salt Lake City, which has four of the five top ZIP codes for case rate in the county, isn’t even in the top 25 for population density among Utah cities. Kearns was rated with the highest population density; it lies in ZIP code 84118, which has the 16th-highest rate of cases of the 37 analyzed ZIP codes, according to the county health department data.
White City was rated second in the state’s population density and that ZIP code, 84070, is ranked 23rd in cases rate. Midvale was third in density and 84047, its ZIP code, rated seventh in case rate.
As Dunn points out, the exact location doesn’t change one major factor of the disease.
"COVID-19 is not going to stop at borders and it’s not going to stop at jurisdictional divides, right? So a risk in Salt Lake City could certainly be a risk statewide as well," she said during Wednesday’s press briefing. "And so we want to make sure everyone in the state is following the governor’s directive, because that’s what is going to ultimately make sure we see a downward trend in cases."
It’s worth noting, Salt Lake County isn’t alone in releasing more localized location data. The Davis County Health Department, located just north of Salt Lake County, breaks its data down by cities. There, the highest rate is in Bountiful, with a rate of 114.94 cases per 100,000 people; neighboring North Salt Lake is listed at second with a rate of 109.41 cases per 100,000 people.
Things could be worse
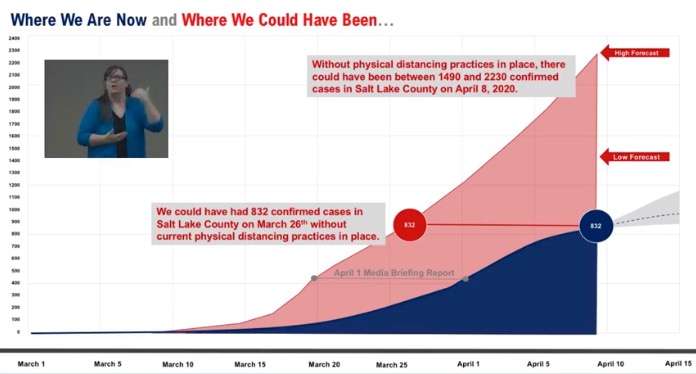
Dunn has said several times during the pandemic that Utah’s relatively low case increase rate seems to indicate that social distancing is working. The Salt Lake County Health Department released a fascinating model during its press conference last week that shows exactly what she is saying.
The model shows the cases the county had that day — 832 on April 9 — would have been reached about two weeks sooner without social distancing and other proactive measures. It also anticipated anywhere from 1,490 to 2,230 cases in the county by April 9 without those measures. If we look at the county’s hospitalization rate, which is currently, 9.9%, that could have meant about 220 hospitalizations at that point, as compared to 128 the county reported, as of Tuesday.
That's only Salt Lake County; just imagine what that would mean statewide.