Estimated read time: 6-7 minutes
This archived news story is available only for your personal, non-commercial use. Information in the story may be outdated or superseded by additional information. Reading or replaying the story in its archived form does not constitute a republication of the story.
PROVO — Are the diagrams of the water cycle we’re accustomed to misleading?
That depends on the diagram, but that’s likely the case because most diagrams don’t account for human interaction or water pollution, according to a new study led by BYU researchers published in Nature Geoscience Monday.
That’s important, they say, because the human role in the water cycle drastically changes what we know about the water cycle and how it works. As a result, they believe, any omission helps give learners a false sense of global water security.
The study was conducted by staff and students at BYU, as well as experts from Michigan State University and the University of Birmingham in the United Kingdom. Partners helped in the United States, Canada, France, Sweden and Switzerland also helped. The study found that only 15% of nearly 600 diagrams studied from textbooks, scientific literature and online sources across the world depicted any sort of human interaction with water, and that only 2% of diagrams showed any sort of climate change or water pollution.
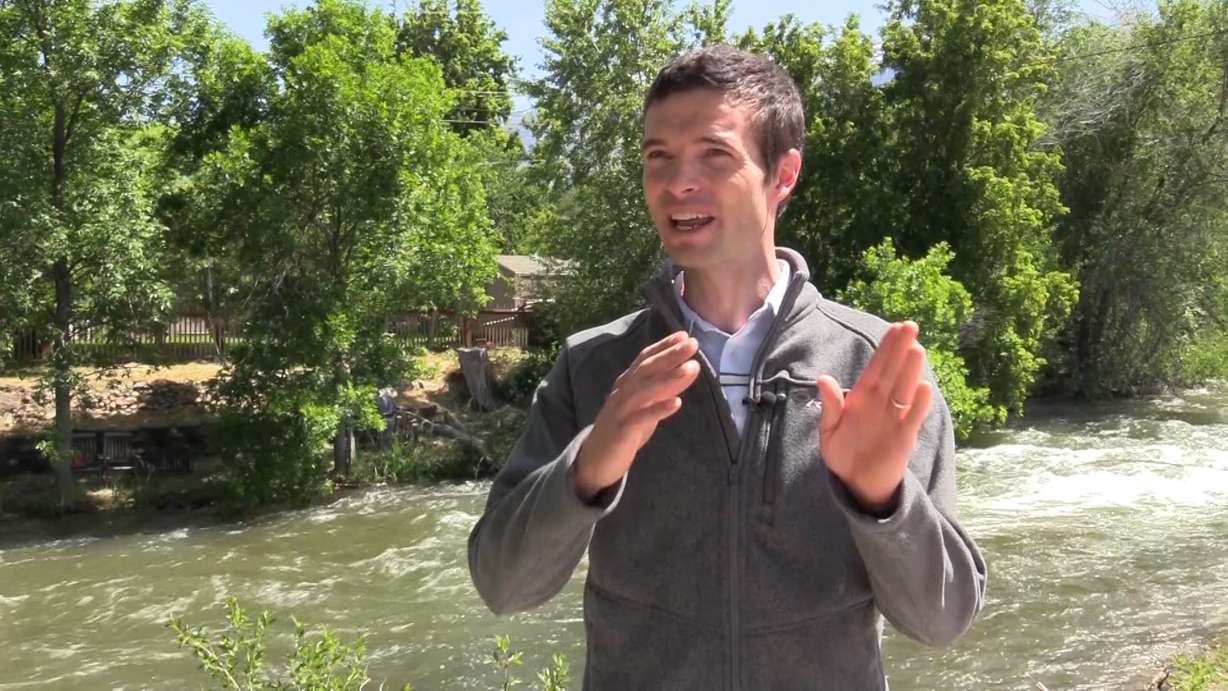
“We were completely shocked when we saw how few diagrams showed people. ... We can't get our water predictions right; we can't manage the water cycle effectively without integrating humans into it," Ben Abbott, the study's lead author and assistant professor of ecosystem ecology at BYU’s Department of Plant and Wildlife Science, told KSL.com.
David Hannah, a professor of hydrology at the University of Birmingham and a co-author of the study, agreed that diagrams are leaving out crucial elements.
“By leaving out climate change, human consumption and changes in land use, we are, in effect, creating large gaps in understanding and perception among the public and also among some scientists,” he said in a statement.
The study informally started about three years ago when Abbott attended a workshop in France. While talking with colleagues there, the conversation turned to the standard water cycle diagram found in elementary school textbooks and if it was in any way similar to the climates any hydrologist deals with. Over the next couple years, their question went from a workshop tangent to actual analysis.

The researchers thought drawings helped understand how people in regions or countries believed the water cycle worked without dealing with language barriers or anything else that could skew what people truly believe about the matter.
“It’s kind of like the diagrams revealed their deep beliefs about the water systems,” Abbott said. “It’s kind of a cool window into how different disciplines and different groups of people were understanding water.”
The models they looked at ranged from grade school textbooks to scientific peer-reviewed publications to online image search results.
They found interesting tidbits within those understandings along the way. First, they didn't find much difference across countries or even academic level — although some diagrams were more complicated than others. They also found that most diagrams had standard designs of the water cycle that don’t address the various nuances of cycles in different U.S. or world regions. Utah's water cycle differs from the cycles in the Midwest and that differs from the East Coast, is an example of the differences.
That also matters because how you adjust the land can factor into the water cycle, Abbott said. He pointed to deforestation of the Amazon forest in South America, where removing forestland affects the rain patterns across the entire continent.
They also pooled in data from other water studies and found that people use twice as much water as the groundwater recharge — the main way natural aquifers refill. It’s hard to comprehend how much water that is.
“It’s the most extracted natural resource on earth,” Abbott said. “It’s about half of the global river flow to the ocean. It’s this huge proportion.”
Researchers figured diagrams would depict that, but they didn’t, for the most part. While it seems minor or possibly an oversight, they believe it may show a disconnect in how people see water availability or quality.
Nearly 40% of all surveyed rivers, lakes or estuaries in the U.S. were “not clean enough to meet basic uses like fishing or swimming," the Environmental Protection Agency wrote in 2015. That same year, 1.8 million people died worldwide from diseases related to water pollution, according to a study published in The Lancet in 2017.
Yet few diagrams showed that a good chunk of the earth’s water drinkable water isn’t even drinkable and even fewer diagrams accounted for climate change, Abbott said.
“The human-water footprint is massive and that’s why we were shocked when 85% of these diagrams showed no interactions between humans and water,” he added. “It was natural landscapes with abundant fresh water. You couldn’t see anywhere how humans have changed the availability of water, the amount of water that’s there or the quality of water.”
Researchers were set to release the study roughly 1 1/2 years ago, but delayed it piece together what a diagram should look like. They figured it wouldn't be the go-to diagram, but at least it would maybe point water cycle diagrams in the right direction.
They contracted a Provo artist to come up with a graphic that factored in different climates and impacts from humans. It showed that 77% of the earth's surface has been modified by things like farming, grazing, urbanization or any other direct human influence. They also merged data from about 80 studies to factor in changes in water cycles caused by humans, Abbott explained.
"The image still has limitations," he lamented. "It's a single image. It's not showing all the different dynamics it needs to."

The researchers soon hope to create a website that houses multiple versions of water cycles so anyone in the world can view a cycle that matches their habitat more accurately. They want those teaching children at home or in schools to find water cycle diagrams that take human interaction into account, and they're also planning to make more interactive diagrams in the future.
As for what humans can do reduce water consumption, Abbott said the majority of global water footprint is affected by grazing animals. For example, it's believed that agriculture accounts for 82% of all water consumed in Utah, according to data reported by the state's Governor's Office of Management and Budget. Eating less meat and dairy can result in less grazing and lower the amount used for livestock.
In addition, Abbott said, water infrastructure projects like dams and dikes also play roles in disrupting water cycles, so fewer projects may impact the system as well.
"I've got four kids; I'm not advocating for humanity to stop," Abbott said with a slight chuckle. "But there are some simple changes we can make that would vastly decrease the negative impacts that we have on the water cycle and ensure more sustainable water management in the future."


