Estimated read time: 6-7 minutes
This archived news story is available only for your personal, non-commercial use. Information in the story may be outdated or superseded by additional information. Reading or replaying the story in its archived form does not constitute a republication of the story.
SALT LAKE CITY — The percentage of positive COVID-19 tests to all tests taken, or positivity rate, has become one of the better statistics to determine the spread of the coronavirus since the pandemic began earlier this year.
That's because it better articulates the likelihood of where the number of COVID-19 cases that haven't been identified are than a positive test does. As health experts at Johns Hopkins University explained, this number informs public officials about how a disease is spreading through a community and if enough testing is being done to account for all cases.
It's a statistic that is easy to calculate: It's simply the number of positive tests divided by the number of people tested multiplied by 100. So if you test 10,000 people for COVID-19 and 1,000 return positive, the rate is 10%. The higher the percentage, the stronger indication there's high transmission of the disease with more cases likely unreported.
"The percent positive is a critical measure because it gives us an indication of how widespread infection is in the area where the testing is occurring — and whether levels of testing are keeping up with levels of disease transmission," Johns Hopkins University experts wrote.
Dr. Angela Dunn, state epidemiologist for the Utah Department of Health, spoke about this statistic during the state's past two media briefings. The statistic essentially acts as a barometer for the state's COVID-19 situation. As percentages reach 10%, 15%, 20% and more, public health officials are alerted that the disease is rapidly spreading with more positive cases out there than reported.
"That means there's a lot of spread in the community and that you're likely not catching everybody who has the disease because of the spread," Dunn said during a press briefing last week.
It's not until rates plummet back to around 3-5%, with heavy testing, that experts begin to believe they are identifying everyone with the coronavirus.
A rising statewide total
Total COVID-19 cases isn't the only thing on the rise, so is the positivity rate. The rise of COVID-19 cases becomes a concern when those cases lead to hospitalizations, lingering health problems, or even death. Even though Utah's recovery rates are promising, the statistics still indicate there are 2,000 new cases every day; 10 of those individuals will ultimately succumb to complications from it. Dozens more will end up in hospitals, and the state is already dealing with capacity issues.
The state's positivity rate began to climb in early September, shortly after K-12 schools and colleges began the new school year. As you may recall, this was about the time the latest surge in new COVID-19 cases began. Officials blamed this rise on 15- to 24-year-olds participating in parties and extracurricular activities without masks.
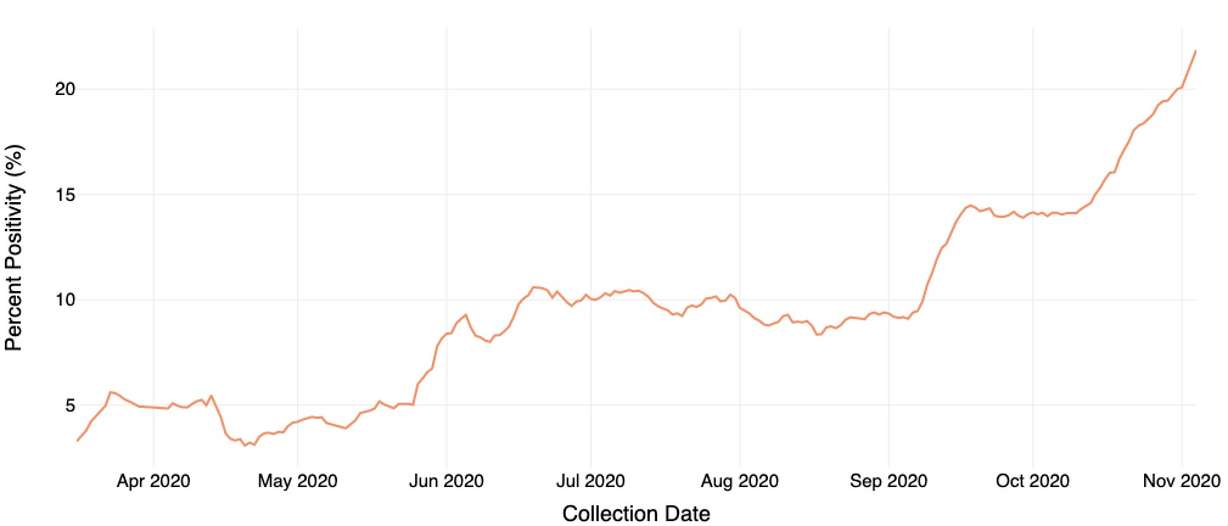
The state health department reported a 9.1% seven-day running average positivity rate on Sept. 5, which was consistent with the rate going back to mid-to-late June. That rate steadily rose to a high of 14.5% on Sept. 18 before reaching another plateau.
The plateau around 14% lasted a couple of weeks before another surge. The state's positivity rate hasn't stopped increasing since Oct. 10, when it was 14.1%. That rate reached 21.8% through Nov. 4. The rate is expected to climb further based on the unofficial total number of positive tests and the number of tests taken since that date.
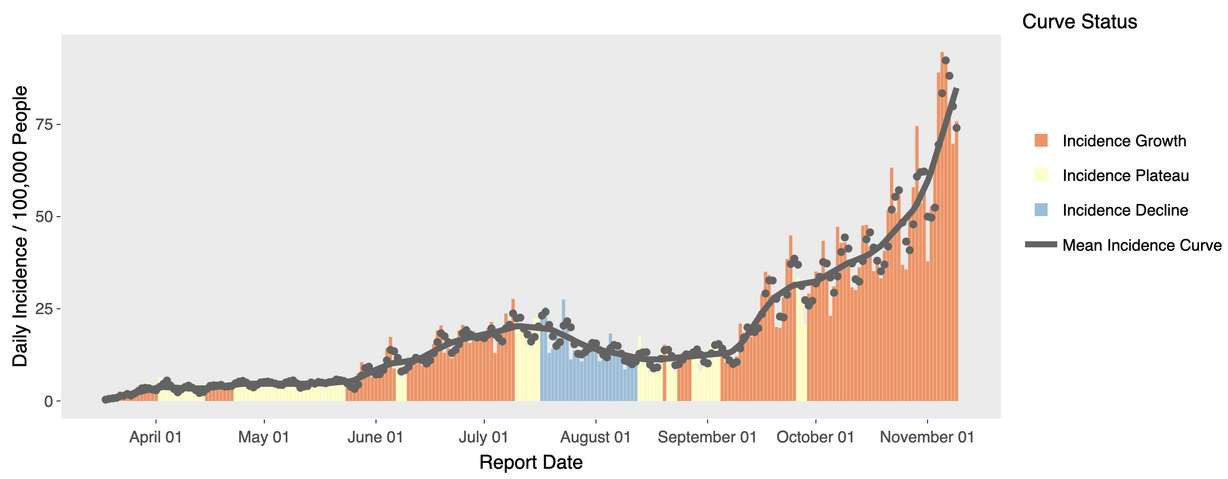
To no surprise, the state's epidemiological curve shows the same story regarding the number of new COVID-19 cases, and those are just the cases the state knows about. Hospitalizations also follow this trend.
"There are a lot of cases out there who don't even know they have COVID, and so they're out coming into close contact with individuals and potentially spreading the virus," Dunn explained on Monday. "We need to identify everyone who has COVID-19 in order to stop the spread of it."
She also said the positivity rate among 15- to 24-year-olds alone is above 20%. It's partly why the state ordered this week that all higher education institutions participate in weekly asymptomatic testing beginning by the start of 2021.
The state's rate is significantly higher than the national average, which is also on the rise. The national positivity rate is now up to 8.3%, per Johns Hopkins University data. The university pulls its data from The COVID Tracking Project, which lists its positivity rate for Utah at 18% — a bit lower than the state health department but still within the 10-highest positivity rates in the country.
KSL.com uses state health department data for all COVID-19 stories unless stated otherwise.
Where in Utah is this rate the highest?
The state health department has continued to provide new data sets throughout the pandemic. Positivity rate trends from Utah's 29 counties is one of the newest statistics made available.
There is a caveat to this data. The state doesn't provide the number of positive tests or tests taken by the county, just the seven-day running average of the county's positivity rate, so some counties may have high rates as a result of a small sample size. For example, when Daggett County reported its first COVID-19 case, the positivity rate shot up from 0% to 33%, but it fell back down to 0% after the positive test was no longer included in the seven-day running average.
Still, it might better show where the virus is spreading around the state — given what we know about what positivity rate tells us.
The first thing that stands out in this field is that rates are high all across the state, except for Daggett County. The area in northeastern Utah hasn't reported a positive test since mid-September. Kane County, at 4.2% on Nov. 4, was the only other county below the current national average. All 27 other counties are above it.
Positivity rates were above the overall state rate of 21.8% in an additional 12 counties, which were, in order of rate:
- Emery: 33.3%
- Garfield: 32%
- Beaver: 30%
- Sanpete: 28.7%
- Carbon: 27%
- Sevier: 26.4%
- Box Elder: 25.9%
- Utah: 25.7%
- Washington: 24.8%
- Salt Lake: 23.1%
- Piute: 23.1%
- Wasatch: 23%
A look at the state's most-populated counties offers another view of the COVID-19 situation. Salt Lake and Utah counties, which account for over half the state's population, both have rates exceeding the state's average. Both have rates exceeding 23%, which is likely an indication as to what is driving up the rate statewide.
Four of the state's 10 most-populated counties reported seven-day average rates above the state's rate. Of the remaining six, another three reported rates over 20%. Summit County reported an upward trend over the past week, which indicates growing spread within those communities — and all over the state.
Here were the positivity rates of the 10 most-populated counties as of Nov. 4, in order of population:
- Salt Lake: 23.1%
- Utah: 25.7%
- Davis: 20.6%
- Weber: 20.4%
- Washington: 24.8%
- Cache: 21.2%
- Tooele: 19.1%
- Box Elder: 25.9%
- Iron: 15.4%
- Summit: 13.9%
Positivity rates grew in 19 of 29 counties since the figures were released, starting with Oct. 25 data. It declined in nine counties — Grand, Kane, Millard, Morgan, Piute, San Juan, Summit, Wasatch and Wanye — during the past week, while Daggett County remained at 0%.
Regardless, this new data shows us that COVID-19 spread isn't really centralized to one area of the state; rather, it's everywhere.