'%3e%3cpath%20d='M34.1406%205.85938C30.3906%202.10547%2025.3047%200%2020%200C14.6953%200%209.60938%202.10547%205.85938%205.85938C2.10938%209.61328%200%2014.6953%200%2020C0%2025.3047%202.10547%2030.3906%205.85938%2034.1406C9.61328%2037.8906%2014.6953%2040%2020%2040C25.3047%2040%2030.3906%2037.8945%2034.1406%2034.1406C37.8906%2030.3906%2040%2025.3047%2040%2020C40%2014.6953%2037.8945%209.60938%2034.1406%205.85938ZM37.0117%2023.543H31.1602V13.5391H27.6328V19.9414C28.1211%2020.6914%2028.3711%2021.582%2028.3711%2022.5625V22.625C28.3711%2023.668%2028.1172%2024.6055%2027.6328%2025.4297V26.6094H36.082C33.4883%2032.9375%2027.2891%2037.3789%2020.0039%2037.3789C10.3711%2037.3789%202.62109%2029.6289%202.62109%2020C2.62109%2010.3711%2010.3711%202.62109%2020%202.62109C29.6289%202.62109%2037.3789%2010.3711%2037.3789%2020C37.3789%2021.1484%2037.2617%2022.2656%2037.0508%2023.3477C37.0391%2023.4141%2037.0234%2023.4766%2037.0117%2023.543Z'%20fill='white'/%3e%3cpath%20d='M22.3086%2018.5352C20.4336%2018.125%2019.9531%2017.8398%2019.9766%2017.1836V17.1406C19.9766%2016.6992%2020.3477%2016.2148%2021.4023%2016.2148C22.582%2016.2148%2023.8867%2016.6797%2025.0781%2017.4766L26.8516%2015.0195C25.4453%2013.8906%2023.707%2013.3398%2021.5547%2013.3398C18.5195%2013.3398%2016.4375%2015%2016.4063%2017.4766V17.5352C16.3633%2020.2617%2018.5859%2020.9805%2021.293%2021.6016C23.0391%2021.9766%2023.5703%2022.3164%2023.5703%2022.9609L23.5469%2022.9766C23.5469%2023.3906%2023.2578%2023.7031%2022.7852%2023.8359C22.5742%2023.9062%2022.1289%2023.9727%2021.5156%2023.9727C20.7617%2023.9727%2019.7539%2023.8633%2018.6328%2023.4844C18.0898%2023.2891%2017.4727%2023.0039%2016.8047%2022.6133L20.1406%2026.625C20.2813%2026.6602%2021.0977%2026.8516%2021.7734%2026.8516C25.0039%2026.8516%2027.0859%2025.2461%2027.1094%2022.6328V22.5703C27.1602%2020.1133%2025.2148%2019.1719%2022.3086%2018.5352Z'%20fill='white'/%3e%3cpath%20d='M5.24219%2013.5664V26.6133H8.75391V23.7578L10.2969%2021.9531L14.2031%2026.6133H18.3867L12.3555%2019.5195L17.4023%2013.5664H13.4531L8.75391%2019.0586V13.5664H5.24219Z'%20fill='white'/%3e%3c/g%3e%3cdefs%3e%3cclipPath%20id='clip0_97_2430'%3e%3crect%20width='40'%20height='40'%20fill='white'/%3e%3c/clipPath%3e%3c/defs%3e%3c/svg%3e)


Estimated read time: 6-7 minutes
This archived news story is available only for your personal, non-commercial use. Information in the story may be outdated or superseded by additional information. Reading or replaying the story in its archived form does not constitute a republication of the story.
SALT LAKE CITY — Utah is growing and changing, including becoming more diverse over the past six decades, with close to one-fourth of the population now identifying as a racial or ethnic minority. Close to 1 in 7 residents are Latino or Hispanic. But its "distinctive demographic profile" remains that of a "youthful, aging and predominantly urban state."
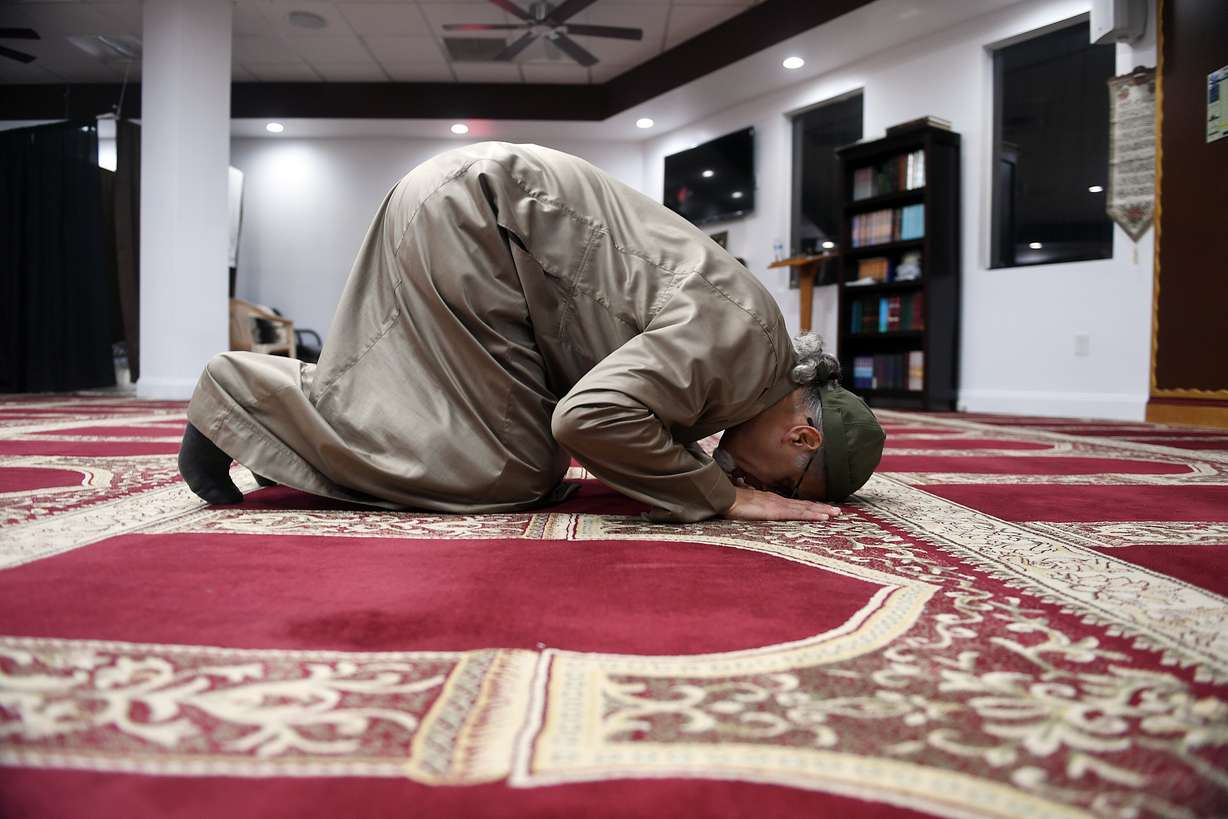
According to the Kem C. Gardner Policy Institute's just-released data book on Utah demography, the Beehive State has a "striking collection of faith traditions" and the greatest share of religious adherents in the country.
Between 1 in 8 and 1 in 4 have some type of disability, the range explained by the definition of a disability and the data source the institute scoured.
And when it comes to economic well-being, health, education and housing outcomes, variations abound based on disability, race, sex, age and other factors, including whether someone has a disability. For instance, with the exception of those who are Asian, the state's ethnic and racial minority populations are more apt than Utah's white population to have lower household income and accumulated wealth, lower educational status, fewer homeowners and to pay more for housing costs.
"Every Utahn has a different experience, which can be influenced by their age, disability, ethnicity, geographic location, race and sex, among other characteristics," said Mallory Bateman, director of the Kem C. Gardner Policy Institute, in a news release. "This publication provides data insights to inform decisions and start conversations. Due to the complexity behind many of these differences, this resource does not attempt to explain or assign causality for the included topics."
The report notes that "Utah women show significantly lower median personal income, slightly higher poverty rates, lower labor force participation rates, a greater share of post-secondary degrees, higher life expectancies, higher share with depression and a slightly higher share with disabilities" compared to Utah men.
Diversity
West Valley City and South Salt Lake are the most racially and ethnically diverse locations in the state. The report said the two cities have an "over 60% chance two residents have different racial or ethnic backgrounds." Just 10 states have higher diversity index values than these two Utah cities, including California, Hawaii, Nevada, Texas and Maryland.
Overall, white people who are not Hispanic make up 77.3% of the state's population, while 1 in 7 are Hispanic or Latino, per the report. Of those who are not Hispanic, Asians account for 2.3% of the population. Black people are 1.2% of the population, American Indian or Alaska Native 1%. Just over 5% are another race alone, while 5.6% are two or more races, based on data from the U.S. Census Bureau's 2021 American Community Survey five-year estimates.
The report says 17 states have lower diversity index values than Utah.
Age
Utah's long been known for one of the nation's youngest populations, and that hasn't changed, but declining fertility rates and an aging adult population have raised the average age of those in the state.
In 1980, 1 in 12 Utahns were over 65, while by 2020 the share was 1 in 8. The forecast is that by 2060, more than 1 in 5 Utah residents will be over 65.
The report notes big differences in age when it comes to diversity. For instance, 22.5% of children under 5 are Hispanic or Latino, while almost 90% of adults at retirement age are non-Hispanic white.
Money
The median personal income among young adults ages 25 to 44 in 2021 dollars is $38,400. Men in that age group far outpace women in earnings, $53,700 to $24,000. White non-Hispanics earn slightly more than Asian Utahns, $40,500 on average compared to $40,000. People who are two or more races average $37,400, compared to Native Hawaiian/Pacific Islanders at $32,900, Hispanics or Latinos at $31,600. Those of other races are at $30,300, and Black people are at $29,000. American Indian/Alaska Natives in that age group average $26,000.
The report finds that "labor participation rates peak for Utah women at 82%" among those ages 22-24. After that, it fluctuates between 60% and 80%, then drops after 55 as retirement age approaches.
Education
In assessments starting early and continuing through postsecondary education, white and Asian students have better educational outcomes, compared to other racial and ethnic groups, the report says, noting that "educational attainment levels influence incomes, which in turn influence educational attainment and incomes of the next generation. In this sense, the impact of education is bidirectional and multigenerational."
The report also notes that schools with more economically disadvantaged students may have worse education outcomes. Additionally, women and people of color earn less compared to others who have the same educational attainment.
Health
Utah's average life expectancy is 79.5 years, more than three years longer than the national average. Utah women live an average of 4.4 years longer than Utah men. And there's more than a decade difference between the life expectancy of Asians, who live on average the longest (86.6 years), and Native Hawaiian/Pacific Islanders who live the shortest, at 76.1 years.
The report notes that uninsured rates are highest for Utah's Hispanic, Black and American Indian/Native Alaskan populations. The highest rates of uninsured based on age are found among those ages 19-49.
Utah's minority populations suffer higher rates of chronic conditions including diabetes, asthma, depression and obesity. Women self report higher rates of diagnosed depression, at 32.1%, compared to men, at 16.3%.
Housing
More Utah families live in houses they own than are found in the rest of the country, 70.4% compared to the national 64.6%. The lowest share, at 27%, is found among Black households, while the highest is among white households, at 74%.
Meanwhile, the report said Black and Hispanic owners and renters "have the largest share of households with housing costs burdens. About 1 in 4 Black, Pacific Islander and Hispanic renters classify as 'burdened' because they pay 30% to 49% of their income for rent. Black homeowners and renters have the highest shares of households with severe housing cost burden (greater than 50% of their income spent on housing)."
Disability
Although a pair of national surveys estimate the rate of Utahns who have a disability in ways that create a sizable range — between 12% and 25% — they agree that Utahns with a disability are more apt to have lower income and education attainment, higher housing cost burdens, worse health and less access to health insurance. They also agree that the share with a disability will rise as the population ages.
The report shows that 12.4% of Utahns with a disability receive Social Security income. "In 2023, the maximum monthly SSI payment for an individual is $914, approximately $10,968 annually." And while 80% of Utahns who don't have a disability are employed, that's true of just 54% of those who have a disability. But the rate varies depending on the type of disability.
Between 2019-2021, the Utah Behavioral Risk Factor Surveillance System reported that 12.9% of those with a disability had a cognitive challenge, while 9.3% had a mobility disability. It said that 6.6% had an independent living disability, 5.6% were hearing impaired or deaf and 3.2% had visual impairment or were blind. The final 2.5% were classified as having a self-care disability.
By race and ethnicity, among Utah adults with a disability, the largest group was American Indian/Native Alaska at 37.7%, Black at 27.3%, Pacific Islander at 22.7%, white at 23.3% and Asian at 12.4%. More females than males have a disability, 25.5% versus 22.1%.
The highest employment rates among those with a disability include the 71.7% of those who have difficulty hearing or are deaf who work and the 58.5% of those who are visually impaired or blind who are employed.

Most recent Health stories
Related topics
 Lois M. Collins